LakeLens: Making Urban Lake Health Visible Through Science.
Founder & Lead Researcher · Independent Major Impact Project
What LakeLens is
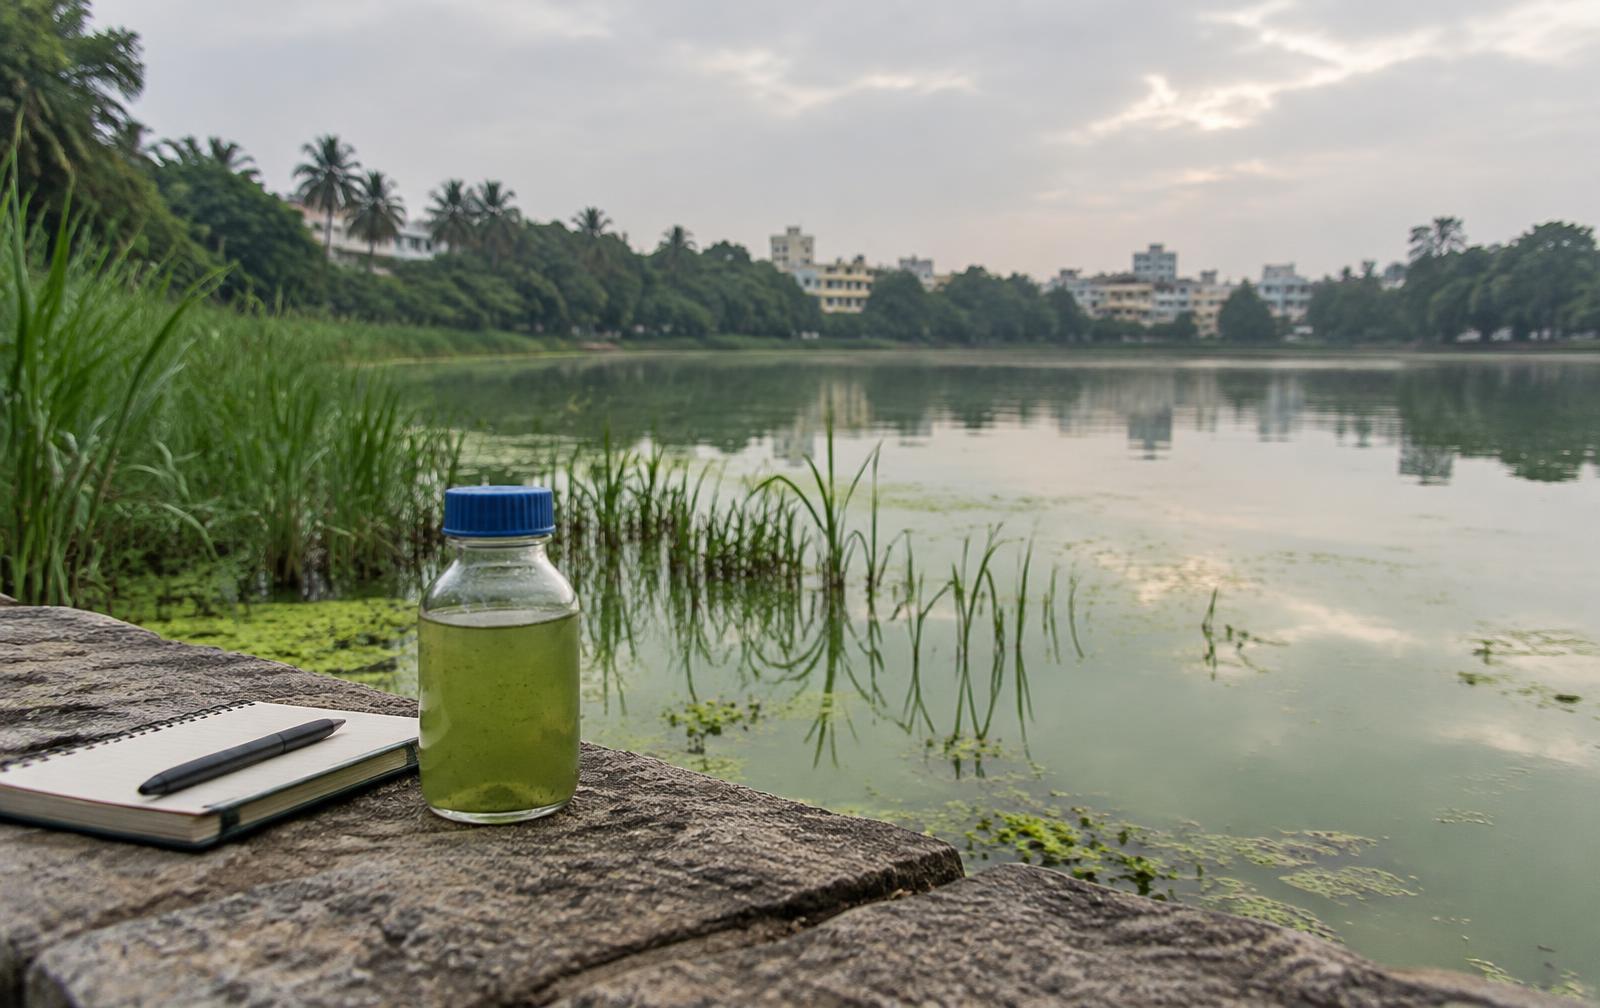
LakeLens is an independent field-science project mapping water quality and plankton diversity across five urban lakes in Hyderabad.
The project explores how scientific observations, water-quality testing, biological documentation, and data visualisation can make the health of urban lakes more accessible to communities.
Why these lakes needed watching
Urban lakes face environmental pressures that can affect water quality, oxygen levels, and aquatic biodiversity.
LakeLens was developed to document lake conditions systematically and communicate scientific observations through accessible visual reporting.
Research methodology
- Sampled five lakes over three rounds, completing 15 visits
- Measured seven indicators: pH, dissolved oxygen, nitrate, phosphate, turbidity, temperature and Secchi depth
- Logged 120+ plankton images on iNaturalist
- Built a 0–100 lake-health index
- Created an interactive map with five lake report cards
- Presented the findings to a lake-conservation group of approximately 40 people
Sampling days
Five lakes were sampled over three rounds, completing 15 field visits.
Lake measurements
The seven measured indicators were combined into a single 0–100 lake-health index so that lake conditions could be compared and communicated simply.
Plankton documentation
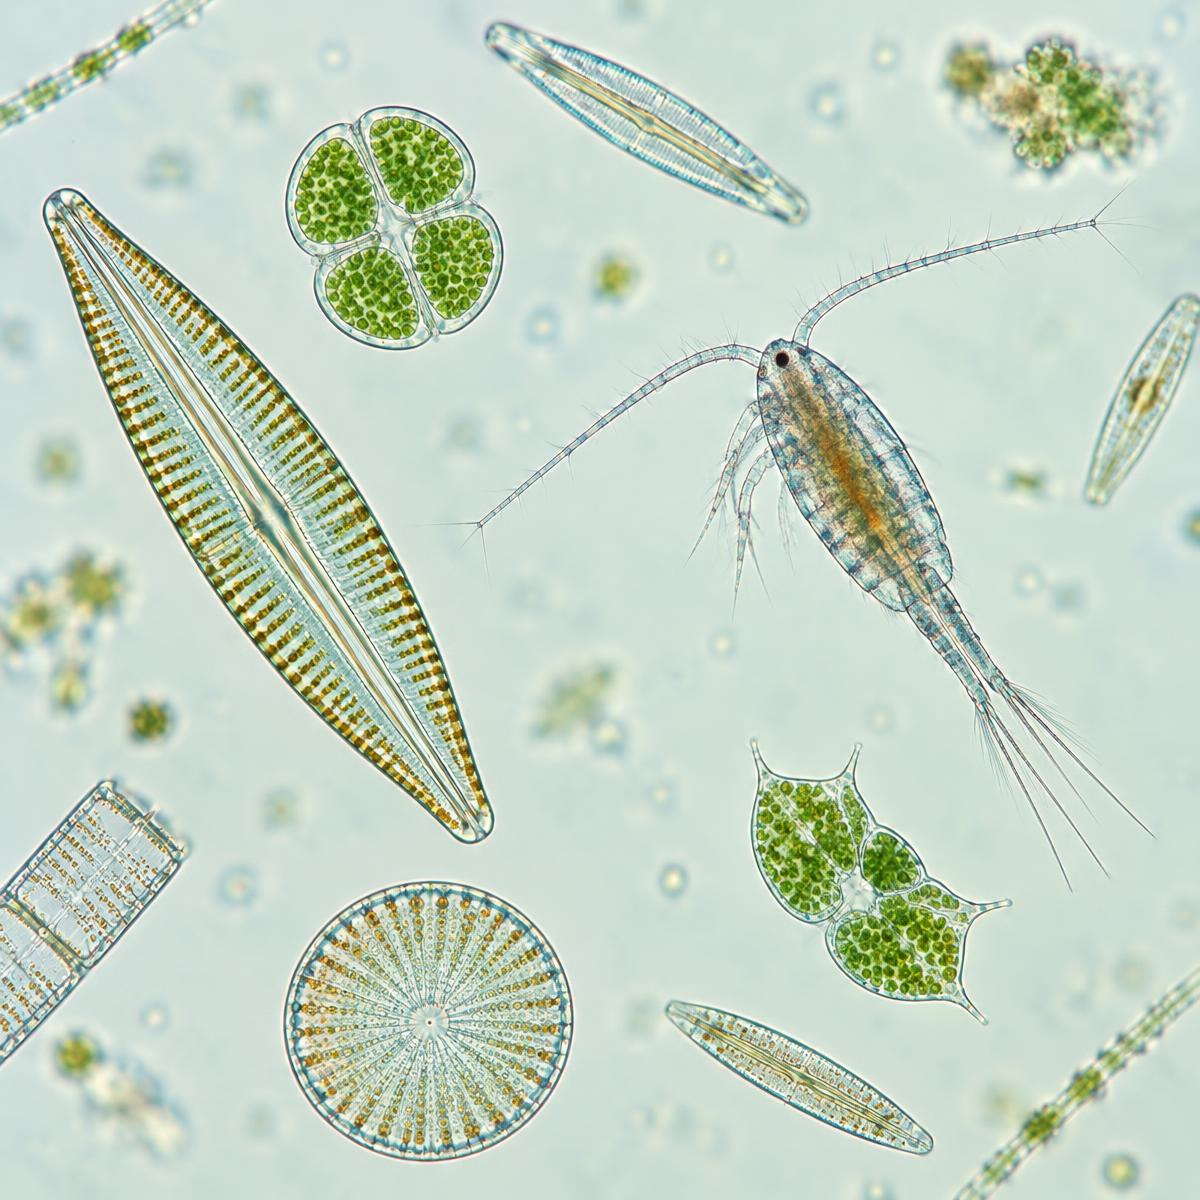
More than 120 plankton images were logged on iNaturalist to document the diversity of microscopic life in each lake.
- Five lake assessments
- Water-quality dataset
- Plankton image documentation
- Lake-health index
- Interactive map
- Five individual lake report cards
- Presentation to conservation stakeholders
Community presentation
The findings were presented to a lake-conservation group of approximately 40 people.
Seeing green, oxygen-starved lakes close to home turned ecology into something urgent. Collecting data myself taught me rigour, and sharing it with residents showed me that science matters most when people can use it.